
Working as an industrial engineer in the manufacturing and service industry for many years thought me how to use process mapping as a competitive advantage.
It is a great tool that aims to visualize and understand a process to make it better. As a visual person, it is a game changer for me.
While I map a process, I go through it with the experts (employees with experience) to live the positive and negative sides of it. That will also show your team that you care about what they are doing and will make it a lot easier for you to bring some changes! For me, it is one of the best ways to break the resistance to change.
Instead of just drawing a process to make it visual (which is already a good thing), you MUST go through it to understand what is good and what needs to be improved or eliminated from the process. That is how you will ever achieve your best results!
Before I go on with the different techniques and tools you can use to map your process, let’s look deeper at the definition of Process mapping.
What is Process Mapping?
Process mapping visualizes the steps, activities, inputs, and outputs involved in a process. It is a tool used to help individuals and organizations understand and analyze their business processes in order to identify opportunities for improvement and increase efficiency.
Typically, mapping a process involves creating a flowchart or diagram that outlines each step of a process, including who is responsible for each step, what resources are required, what decision points exist, and what happens next. This can help to identify areas of inefficiency, bottlenecks, or unnecessary steps, as well as opportunities for automation, standardization, or optimization.
Process mapping can be used in a wide range of industries and settings, from manufacturing and supply chain management to healthcare and service industries. It is often used in conjunction with other tools and methodologies such as Lean Six Sigma to drive continuous improvement and organizational change.
Finally, this tool can be used at a strategic, tactical, or operational level within an organization.
- At a strategic level, process mapping can help to align processes with overall business objectives and identify opportunities for competitive advantage.
- At a tactical level, it can help to streamline processes and improve efficiency in specific areas or departments.
- At an operational level, it can help to standardize processes, reduce errors, and ensure consistency in day-to-day operations.
What are the Different Types of Maps?
There are several types of process maps used in process mapping. Here are some of the most common ones:
- Flowchart: This is a type of map that uses shapes and symbols to represent different steps and decision points in a process, and shows the flow of work from start to finish.
- Swimlane diagram or Cross-functional flowchart: This type of map is used to show how different people or departments are involved in a process. It uses “swimlanes” to represent different roles or functions and shows how work flows between them.
- Value stream map: This is a map that shows how a product or service is produced from start to finish and includes information on the value added at each step, as well as any waste or inefficiencies.
- SIPOC: The SIPOC is a mapping tool that stands for Suppliers, Inputs, Processes, Outputs, and Customers. It is a high-level view of a process that helps to identify the key elements involved and their relationships.
How to Map a Process Effectively?
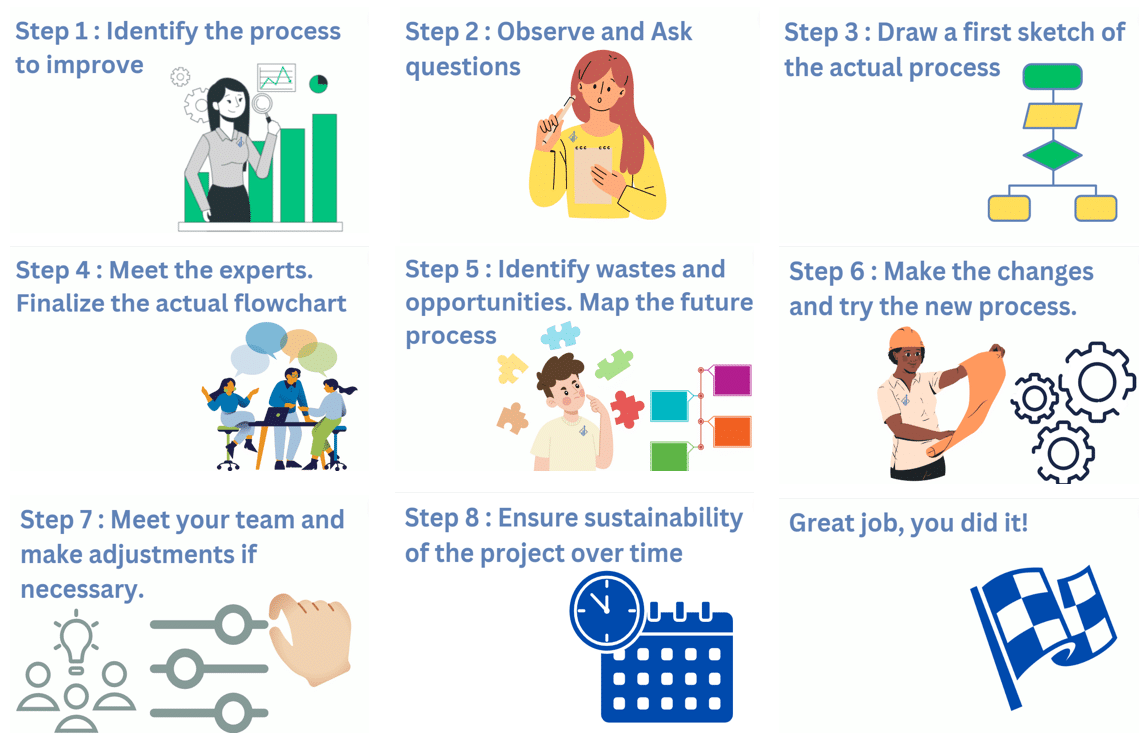
Here is the methodology I use when I map a process. I use these 8 steps every time a project requires process mapping. From the start of my career, I use this methodology at least a hundred times (in the manufacturing business and in the service industry).
- Identify the process to improve
- Prepare yourself by observing each step of the process. Ask questions to the people responsible for each task.
- Draw a first sketch of the actual process.
- Meet the “experts” of this process and present your first sketch. Make sure your “Actual” version of the process is true to reality.
- Identify the waste and opportunity to make the process better. Map the new process with the key employees to ensure you reduce resistance to change as much as possible.
- Make the changes and try the new process. Take notes on what is going smoothly and what needs to be a fine tune.
- Do another meeting with the employees concerned by the changes and make adjustments if necessary. Take time to note what you’ve learned during this exercise.
- Make sure the new process is respected over time and look if you could replicate your good moves in another department or process.
- Move on to another project 😉!
Symbols and their Meaning
To understand or to make an understandable flowchart for your team, you need to use standard symbols.
There are many different symbols that can be used in a flowchart to represent various elements and activities within a process. However, the most used symbols are:
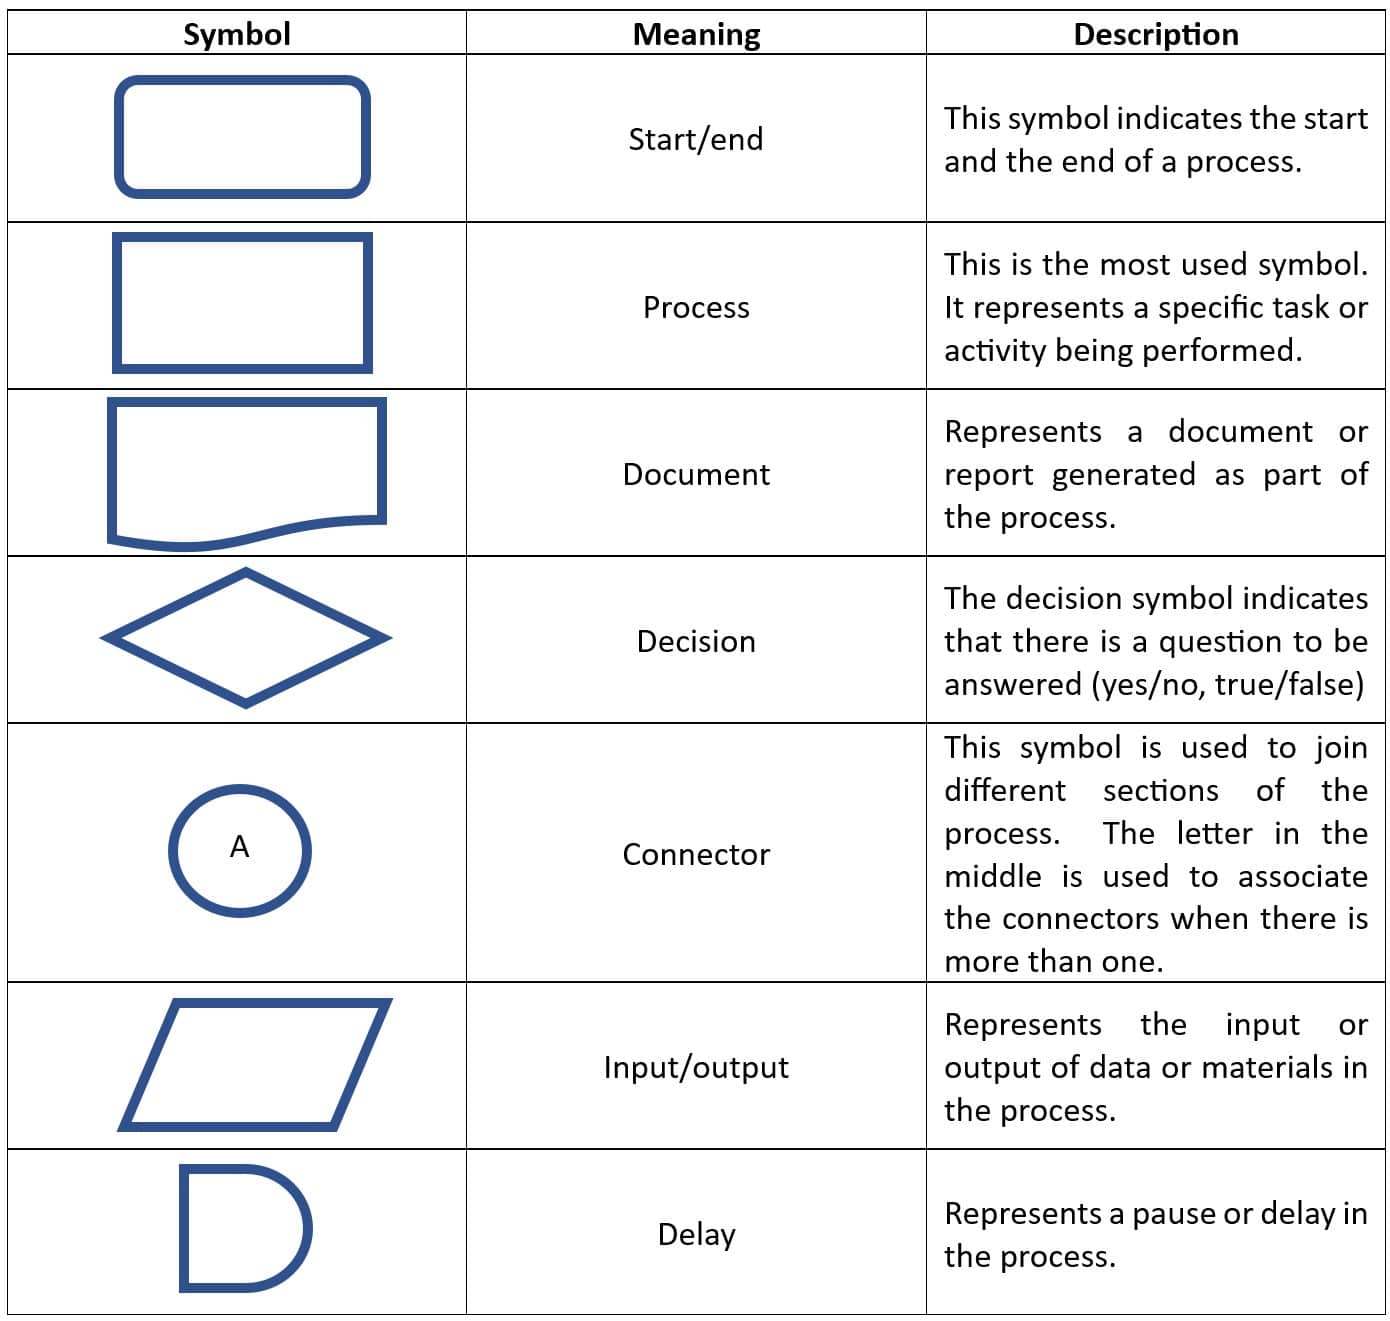
For more information about the symbols used in flowcharts, you can browse this website: https://www.lucidchart.com/pages/flowchart-symbols-meaning-explained
Examples of Each Type of Map and How to Use Them Effectively
Flowchart
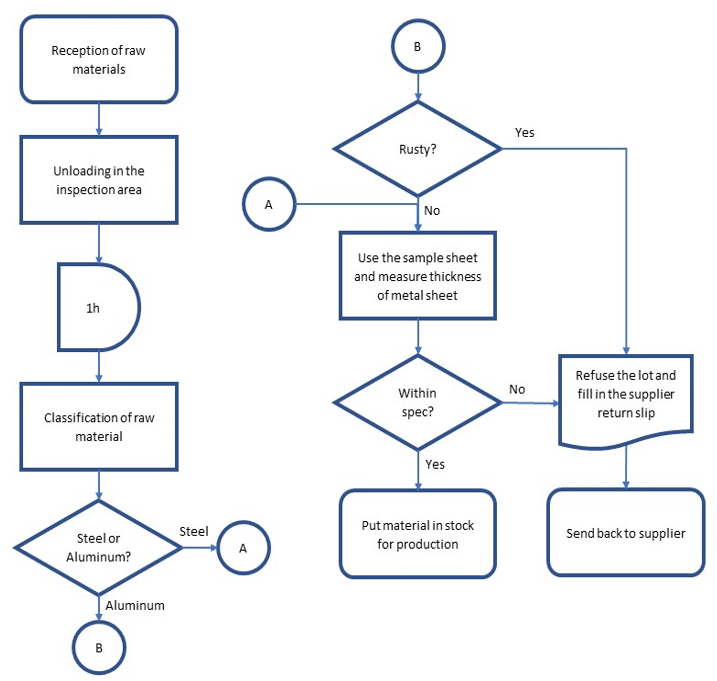
A flowchart is a graphical representation of a process, algorithm, or workflow. A diagram uses symbols, arrows, and lines to show the steps involved in a process or decision-making procedure. The purpose of a flowchart is to make complex processes easier to understand, by breaking them down into simpler, easily understandable steps.
Flowcharts are commonly used in programming, engineering, business, and other fields where processes need to be analyzed and improved. They are helpful in identifying potential bottlenecks, finding inefficiencies, and improving overall efficiency and productivity.
For me, this tool is a good way to improve and visualize processes with a lot of decisions. The flowchart is a dynamic graph that indicated what to do in a specific situation. It is a good tool to facilitate training and increase the autonomy of new employees.
Here is an example of a flowchart for an inspection line of raw materials in a metal sheet business:
Swimlane Diagram / Cross-functional Flowchart
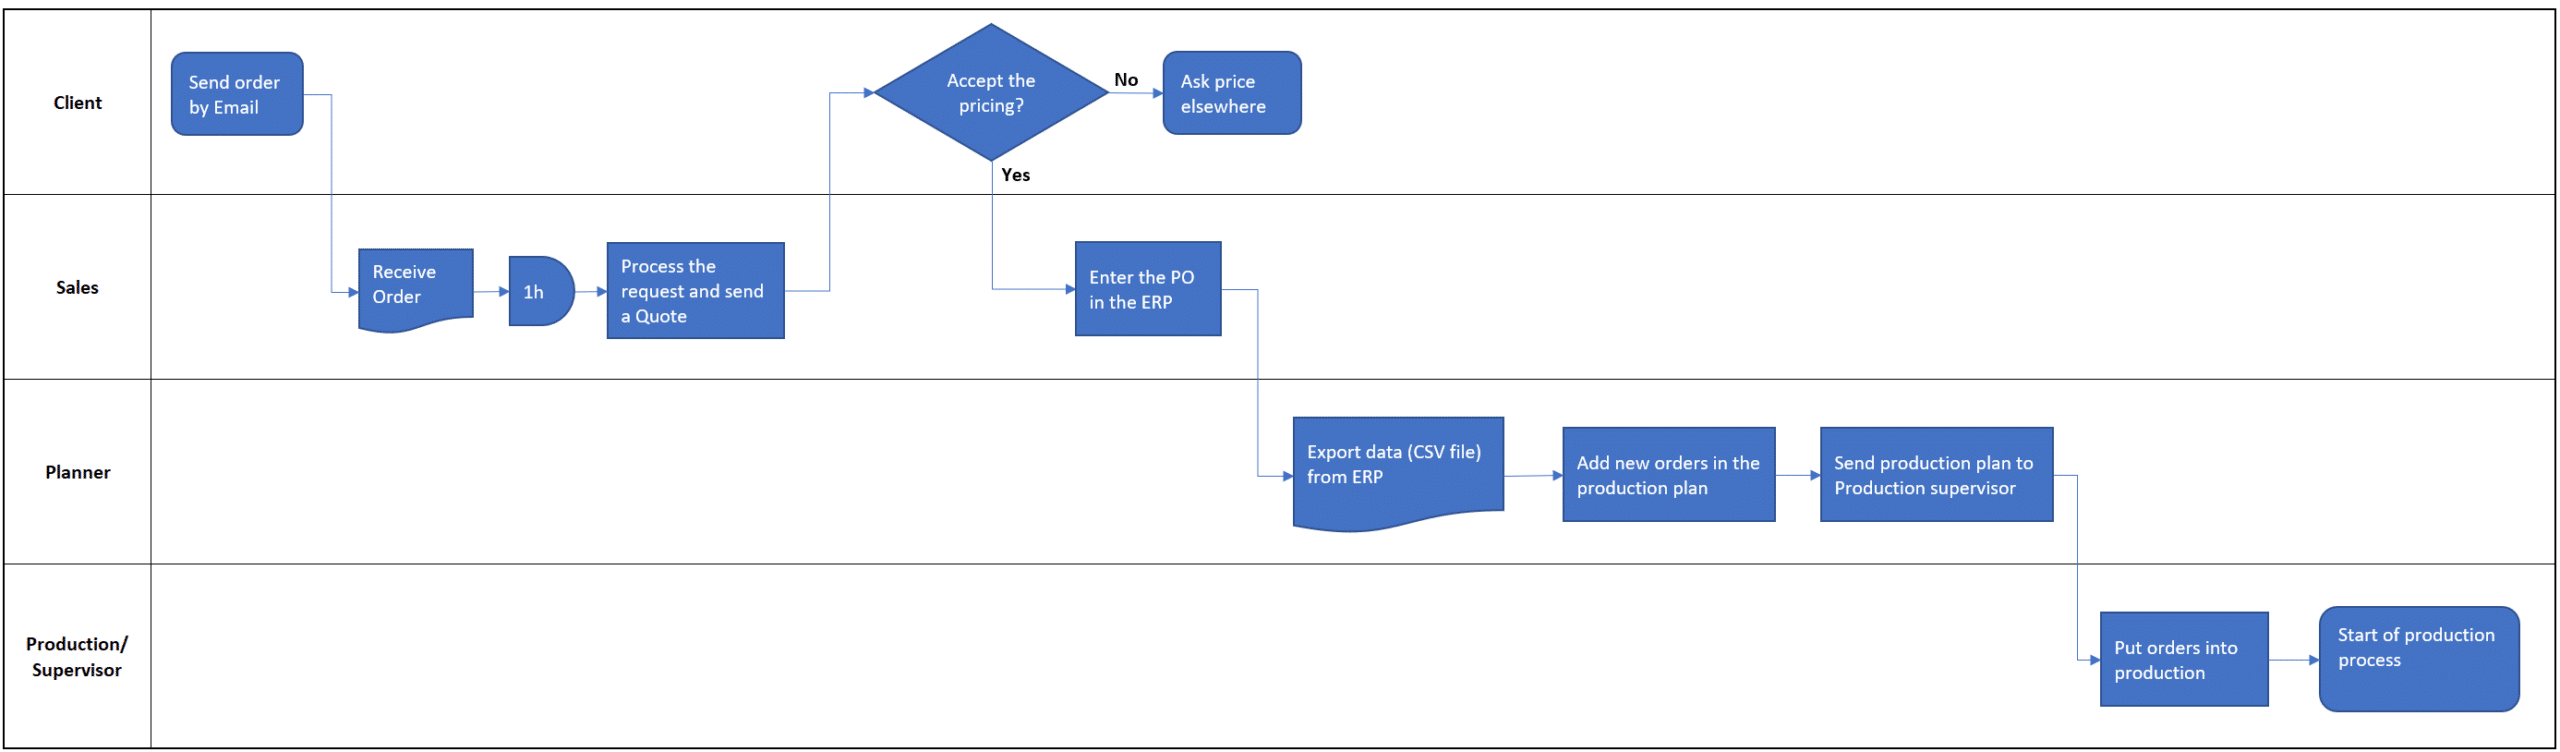
A swimlane or cross-functional diagram is a type of process map that helps visualize the interactions and handoffs between different departments, teams, or individuals involved in a particular process.
The swimlanes are horizontal or vertical bands that divide the diagram into different sections, with each section representing a particular department or team.
Here is an example of a swimlane (cross-functional) diagram for the planning department in a small business.
Value Stream Mapping (VSM)
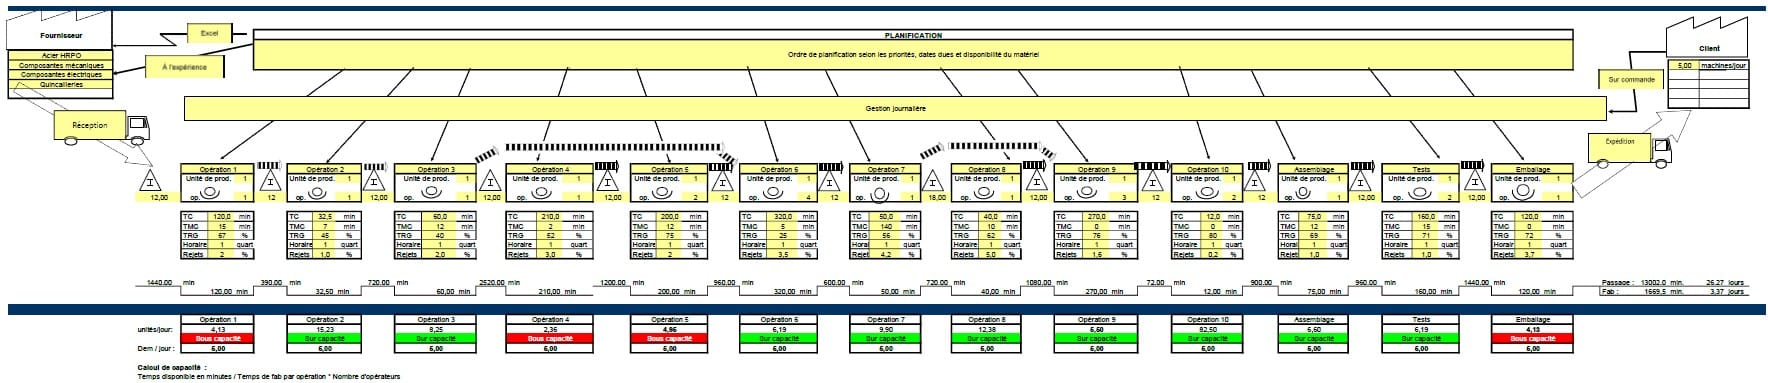
Value stream mapping is a lean manufacturing technique used to analyze and improve the flow of materials and information in a production process. It involves creating a visual representation of the entire value stream, from the supplier to the customer, to identify areas of waste and opportunities for improvement.
The goal of value stream mapping is to identify and eliminate non-value-added activities (i.e., waste) and improve the efficiency and quality of the overall process. It allows organizations to identify and prioritize improvement opportunities, reduce lead times, improve quality, and reduce costs. The main key indicator of a VSM is the Overall Equipment Effectiveness (OEE).
Overall equipment effectiveness (OEE) is a metric used to measure the efficiency and effectiveness of a manufacturing process by calculating the percentage of total productive time that is actually utilized to produce good-quality products. It takes into account three factors: availability, performance, and quality.
- Availability refers to the percentage of time that the equipment is available and operational for production.
- Performance refers to the rate at which the equipment is producing good-quality products compared to its maximum theoretical capacity.
- Quality refers to the percentage of good-quality products that are produced by the equipment compared to the total products produced.
To continue with the value stream map, it typically includes information such as process times, lead times, cycle times, inventory levels, defect rates, and customer demand. The map can be used to identify bottlenecks, excess inventory, unnecessary transportation, and other sources of waste in the process.
Value stream mapping is a collaborative process that involves representatives from different departments and functions within the organization. The team works together to create the value stream map, analyze the data, and identify improvement opportunities. The team then develops an action plan to implement the improvements identified in the map.
This is by far the most powerful and interesting Process mapping. At least, from my Industrial engineer standpoint. The OEE is a great indicator to evaluate the overall efficiency of a business. From a study of about 150 SMEs located in Quebec, the mean OEE of a PME (which can depend from one sector to another) is about 30%. For a world-class company like Toyota, the OEE is around 80-85% and even more.
Here is an example of a value stream mapping. For more information, you can read more in our article about VSM here.
SIPOC
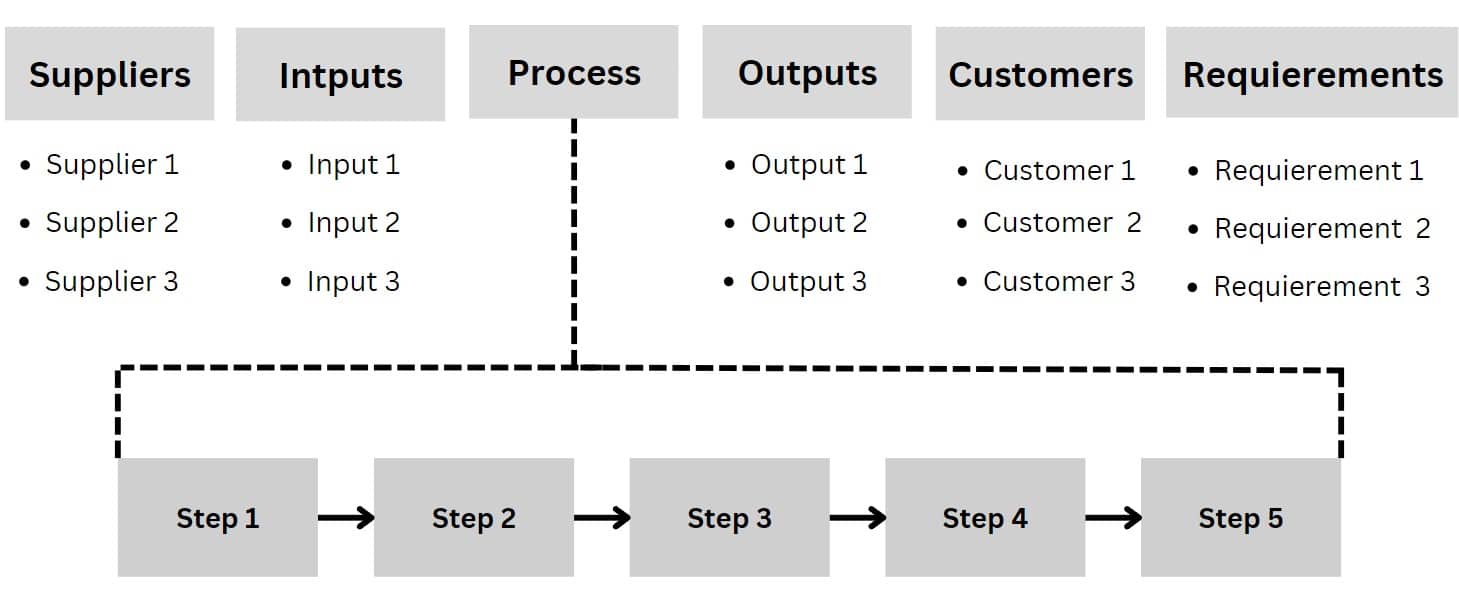
SIPOC is an acronym that stands for Supplier, Input, Process, Output, Customer. It is a tool used in process improvement and Six Sigma methodologies to provide a high-level view of a process and its inputs and outputs.
The SIPOC diagram is a visual representation of the process that includes the following five elements:
- Suppliers: The individuals or entities that provide the inputs for the process.
- Inputs: The raw materials, information, or other resources that are required to start the process.
- Process: The steps and activities that are performed to transform the inputs into outputs.
- Outputs: The end products or services that are produced by the process.
- Customers: The individuals or entities that receive the outputs of the process.
The SIPOC diagram is used to help identify the key elements of a process, and the relationships between them, and to provide a clear understanding of how the process works. It can also be used to identify potential issues, such as bottlenecks or quality problems, and to help prioritize areas for improvement.
Here is an example of a SIPOC:
Tools for Process Mapping
There are different tools that can be used to make a flowchart. Here is a table presenting tools that can be used for process mapping:
|
Tool |
Price | Usability /10 |
Note Quality/Price /10 |
| Word* | 79,00$/year or 169$ | 5 |
5 |
|
Excel* |
79,00$/year or 169$ | 8,5 | 9 |
| PowerPoint* | 79,00$/year or 169$ | 7,5 |
8 |
|
Visio |
76,80$/year or 499$ (standard) | 9 | 7 |
| Lucidchart | About 100$/year | 10 |
9,5 |
*Microsoft 365 bundle
Conclusion
In conclusion, process mapping is a powerful tool for organizations to analyze, streamline, and optimize their operations.
By visualizing the steps involved in a process, identifying inefficiencies and areas for improvement becomes much easier.
Whether you are looking to reduce waste, increase productivity, or improve customer satisfaction, process mapping can help you achieve your goals.
To create an effective process map, it is important to involve all stakeholders, including employees who perform the process, managers who oversee it, and customers who are impacted by it.
By collaborating and gathering input from these parties, you can create a more accurate and comprehensive map that reflects the real-world complexity of your operations.
Additionally, it is important to keep your process maps up-to-date and continually review them to ensure they remain relevant and effective.
As your organization evolves and changes, so too will your processes, and it is essential to adapt your maps accordingly.
Overall, process mapping is a valuable tool for organizations of all sizes and industries. By embracing this approach, you can identify opportunities for improvement, increase efficiency, and enhance the overall performance of your operations.