

An integrated production plan is not just a process—it’s an art. This tactical methodology aids in aligning a company’s production activities with its anticipated demand, ensuring the company produces the right items, in the right numbers, at just the right moment, all while streamlining costs.
As for the strategic plan, it corresponds to the global production plan.
The integrated plan is a tactical order plan that aims to determine “the best ways to meet monthly demand, given the global [(overall)] plan, company policies, and forecast. » (Stevenson & al, 2012)
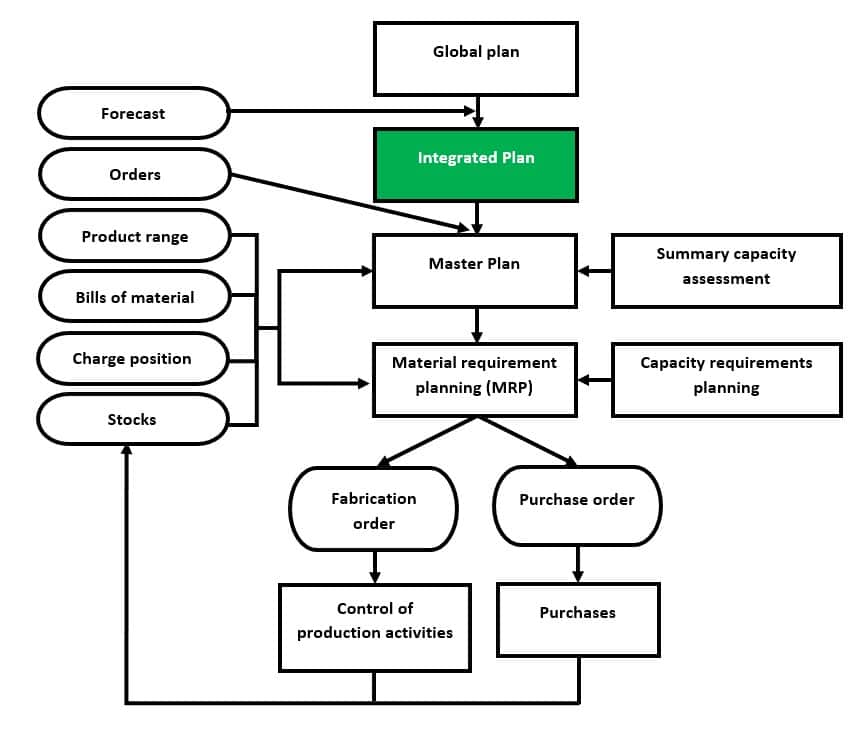
The image below is taken from the book The Management of Operations: Products and Services (Stevenson & al, 2012). It summarizes the production scheduling in its globality.
What is the integrated production plan?
At its core, the integrated plan is about synchronicity. It’s a “monthly tactical plan” designed to dictate how a company should orchestrate itself to meet consumer demand.
This tactical order plan seeks to identify the most efficient strategies to meet monthly demand by weighing the overarching plan, company policies, and forecasts.
To simplify planning and in order not to plan according to each product, the principle of equivalent unit (EU) is used. If the business sells only one product then it doesn’t need to use the EU.
The following section presents the principle of the equivalent units and illustrates this principle using an example.
Equivalent Unit (EU)
The principle of equivalent unit brings “to the same common denominator all the range of products of a company” to put them in relation.
This makes it possible to integrate all the products into the same plan rather than making one plan per product.
This can be done using different denominators such as “man-hours, machine hours, dollars, liters, number of units, [etc.]”. (Stevenson & al, 2012)
Man-hours is the time required for an employee to produce a unit.
In the same vein, machine hours correspond to the time required for machines to manufacture a product.
The following section presents an example of an equivalent unit.
Example of Equivalent Unit (EU)
Company ABC manufactures 4 different products. The following table presents the monthly demand, as well as the machine hours required to manufacture products A, B, C, and D.
|
Products |
Monthly demand |
Machine hours per unit |
| A | 800 |
12 |
| B | 600 |
15 |
| C | 1000 |
10 |
| D | 950 |
8 |
Now, you have to choose which product will serve as UE. Here, let’s take product A.
Next, let’s calculate the monthly demand of company ABC Inc. in equivalent units.
To do this, let’s use machine hours per unit. The table below shows how to do the calculation.
|
Products |
Calculation |
Equivalent Unit |
|
A |
(12/12) * 800 | 800 |
| B | (15/12) * 600 |
750 |
|
C |
(10/12) * 1000 | 833,33 or 834 * |
| D | (8/12) * 950 |
634* |
| Total | – |
3018 units of Product A |
* You don’t sell fractions of products, so you round up.
Since product A is used as an equivalent unit, its production time is used as the denominator. Therefore, we compare each product with this one.
If we take the EU calculation of product B, we, therefore, divide its production time (15 machine hours) by that of product A (12 machine hours). We then reduce the production of product B to product A, which serves as the EU.
Later in this article, an integrated plan with UEs will be presented. We will therefore see the usefulness of this concept in a more detailed example. Furthermore, the integrated plan does not indicate what to produce and when. Rather, it is the production master plan that has this objective.
As a reminder, the integrated plan aims to optimize manufacturing costs by balancing the company’s supply and demand.
The balance between Supply and Demand
To maintain the balance between the supply and demand of a company, we can act on different factors. For example, to vary demand, we can change prices, and delivery times, look for new customers, make promotions, etc.
On the other hand, if we vary the supply or even the production capacity, we can hire or lay off staff, reduce working hours or increase them (overtime), build stocks, use subcontractors, etc.
As a result, the integrated production plan or even the tactical production plan requires decision-making on different spheres of the floor. In their book, (Stevenson & al, 2012) describe the nature of the decisions made when making an integrated plan:
- Hiring and dismissal
- Overtime or Reduced hours
- Inventory levels (increase or decrease)
- Accept production delays
- Use subcontractors to increase production capacity
- Introduce cyclical products
- Marketing (influencing demand through advertising, promotion, etc.)
- Hire part-time workers
These decisions result in three common capacity strategies for optimizing a company’s production costs. That is to say that we seek to reduce the unit cost of production or to increase the profits or the margin per unit produced. The next section presents these 3 strategies.
Common Capacity Strategies
The 3 capacity strategies are synchronous production, leveled, and finally moderate or mixed production.
The synchronous strategy aims to synchronize its production rate with demand. That is to say, we hire and fire according to market demand.
Although once effective in maintaining an optimal production cost, this plan is no longer relevant with the shortage of manpower. Of course, there are exceptions.
As for the leveling strategy, the aim is rather to maintain a stable production rate and to compensate for market fluctuations through inventories.
Therefore, we seek to retain our employees and maintain a stable production rate.
Finally, the mixed production strategy combines the 2 strategies mentioned above.
Steps prior to creating an integrated production plan
Before carrying out an integrated plan, certain preliminary information is necessary. The quality of this information is the key to success in obtaining an optimal plan. That is to say, which will minimize the production costs of the company.
Here are the stages of realization of an integrated production plan including the information necessary for its preparation.
- Determine what to produce for each period. In other words, it is necessary to know the total demand for the products to be manufactured for a given period of time (weekly, monthly, etc.)
- The capacity of the plant must be established for these same periods. For example, for each month, what regular, overtime, and subcontract hours are available?
- Establish company policies with respect to safety stock levels, labor movements, etc.
- Measure or evaluate the various production costs: regular time, overtime, subcontracting, storage, delay, hiring, and firing.
- Make several plans and choose the most optimal
How to make an integrated production plan?
In this section of the text, an example of an integrated plan is presented. In addition, at the same time, the calculations are explained, as well as an Excel file that allows you to optimize your time!
Explanations of calculations
Before proceeding with a detailed example, here are the basic equations found in an integrated plan.
This article proposes an Excel file that contains all the programmed formulas.
However, to understand what is happening in this file, here are the formulas used:
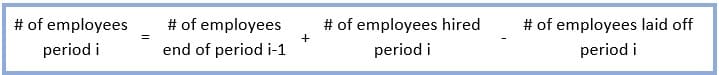
Number of employees available per period “i”
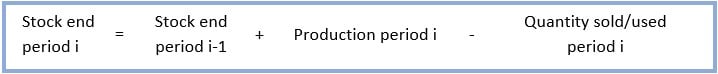
Quantity of stocks at the end of a period “i”
Average stocks for a period “i”

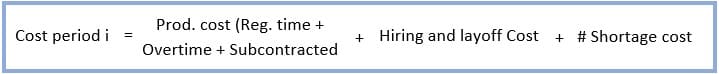
Calculation of costs for a period “i”
Example 1: Integrated Production Plan – Level Plan
Let’s take the example of an ABC company that manufactures washing machines.
The production planner wants to establish an integrated production plan for the next year. To do this, with the help of accounting, he collected the following data:
| Prior information | Cost | Unit |
| Regular time | 30 | $/unit product |
| Overtime | 45 | $/unit product |
| Subcontracted | 65 | $/unit product |
| Production Capacity | 100 | Unit/employee/month |
| Hiring | 1200 | $/employee |
| Layoff | 1800 | $/employee |
| Storage | 4 | $/unit |
| Shortage | 12 | $/unit |
| # of employee (initially) | 180 | Employee |
| Initial Stock | 1200 | Units |
* Note that if necessary, an ending stock could have been specified. That is to say the number of finished products stored for the beginning of the following year.
To carry out his integrated plan quickly, the planner uses the Excel file provided by Collection performance (coming soon).
This allows him to save time and compare different scenarios (leveled plan, synchronous plan, and mixed plan) to reduce production costs.
Here are the results obtained in the case of level production.
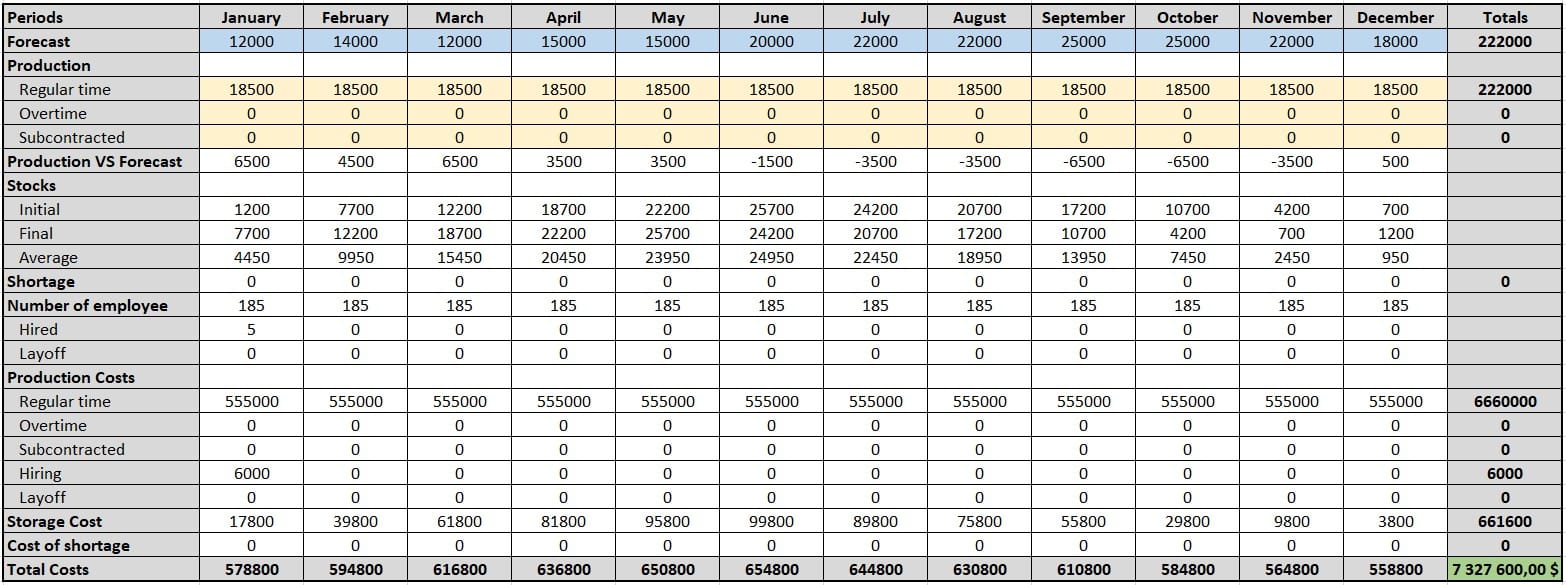
Section – Forecast
The first line of the integrated plan presents the production forecasts. This is the number of units the company expects to sell for each period and is based on forecasting methods using historical company data.
Despite the fact that the company manufactures different machine models, the planner used the equivalent units in order to carry out only one integrated plan.
The integrated production plan is a tactical and not an operational plan. This is why it is done with forecasts rather than with firm orders.
For real and operational planning, it is rather the production master plan that is used.
The purpose of the integrated plan is to forecast its production and optimize its costs based on hiring, layoffs, storage costs, etc.
Section – Production
Then, the “Production” section, in yellow in the table, presents the forecasts for the number of units manufactured on a regular, overtime, and subcontracted basis. In this example, the planner is looking to level his production.
Therefore, he wants to produce exactly the same number of products in each period and maintain the status quo in terms of his staff. To do this, he divides the total planned production (222,000 units) by 12 months (the period number) and gets 18,500 units per month.
As the company has a production capacity of 100 units per employee per month, the monthly capacity of the company is 18,000 units per month. The company, therefore, has 3 choices, hire 5 employees to reach 18,500 units, work overtime or even outsource the missing products.
In this example, the company decides to hire 5 employees, which represents the best solution of the three solutions ($7,327,600 VS $7,424,400 VS $7,544,400). To help you better understand and manipulate the file, we will be happy to send it to you by email completely free of charge!
Finally, the “Production VS Forecast” line is used for calculation purposes in the file. This line corresponds to the difference between the forecast of what there is to produce versus what is planned to be manufactured.
For example, in period 1, 12,000 units are expected to be ordered VS 18,500 manufactured. This is why we find “+” 6500 units in January.
Section – Stocks
The “Stocks” section shows the evolution of stocks over the periods. This section aims to estimate storage costs related to overproduction. The initial stock corresponds to the number of finished products available at the start of the period and the final stock at the end of the period.
The average stock corresponds to the initial stock + the level stock divided by 2. This is used to estimate the storage costs per period.
Section – Shortage and Number of employees
The “Shortage” line shows production delays. This section is used to estimate shortage costs in the event that the company is under capacity. That is to say that it cannot meet the demand with its production + its stocks.
The “Number of employees” section, on the other hand, shows the evolution of hiring and layoffs planned by the company. This section is used to calculate hiring and layoff costs.
Section – Production, Stocks, and Shortage Costs
The last sections of the file present the different costs for each period. It is with the help of these that a decision is made by the planner.
In the example of this leveled plan, we obtain a total cost estimate of $7,327,600. In an attempt to reduce these costs, the planner of company ABC decides to repeat the exercise, but this time, using a mixed integrated plan.
Example 2: Integrated Production Plan – Mixed Plan
Using the same data, but using a mixed, rather than leveled, production strategy, the ABC company planner obtains the following results:
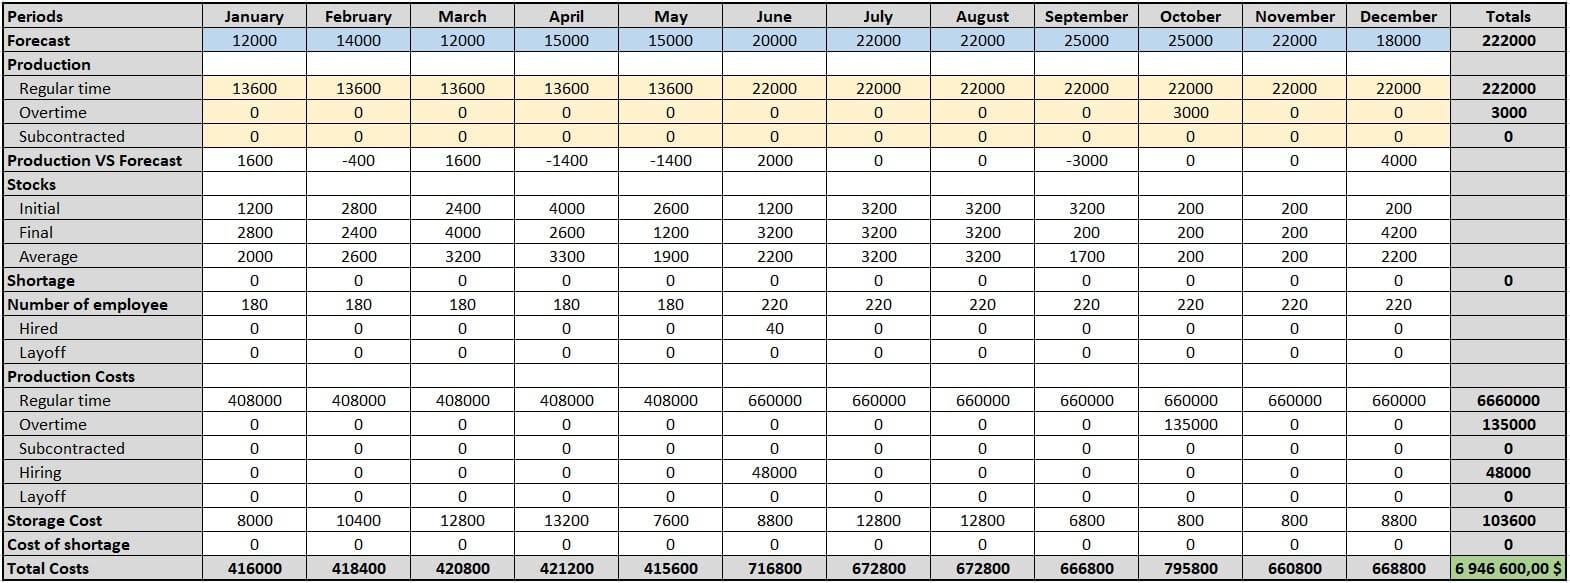
In this example, the planner levels his production in 2 stages. He levels production between January and May, and then he hires staff to level production between June and December. To avoid production delays, he decides to use overtime. The total estimated cost for production goes from $7,327,600 to $6,946,600.
With the help of these results, it becomes obvious to the planner that in his case it is more optimal to use the common Mixed capacity strategy.
Final Thoughts
The integrated production plan is more than a set of numbers—it’s a vision of a company’s future. With the right tools, such as the Excel file provided and algorithms like the transport algorithm, the planner can navigate through various strategies to find the most cost-effective route. Tools like Excel’s Solver, combined with linear programming, can further sharpen these results.
It’s a dance of numbers and strategy, a puzzle where the pieces are ever-shifting demand and capacity. The challenge? To craft the most efficient, cost-effective production plan. And now, equipped with these insights, you’re ready to take on this challenge. Can you out-plan ABC Company and discover even more cost-saving strategies?
Reference