
In an era defined by remote work, gig economies, and cross-functional collaborations, teams across the globe have become increasingly reliant on digital tools to bridge gaps and enhance communication.
Amidst all the chatter about virtual meetings and digital dashboards, there’s an underutilized tool that’s proving its mettle in these challenging times: visual collaboration platforms.
They address a fundamental problem: the human mind processes visual data 60,000 times faster than text, making diagrams and charts quintessential for efficient communication!
What is Visual Collaboration?
Visual collaboration goes beyond merely looking at pictures or watching videos; it’s an immersive, interactive process that leverages visual tools to enhance understanding, brainstorming, problem-solving, and teamwork in a digital space.
Definition and Examples of Visual Collaboration Tools
Visual Collaboration can be defined as the use of digital platforms and tools that allow multiple users to interactively create, manipulate, and discuss visual content in real time or asynchronously.
Some popular examples of visual collaboration tools include:
- Mind Mapping Tools: Platforms like MindMeister or XMind allow teams to brainstorm and organize thoughts visually.
- Digital Whiteboards: Tools like Miro or MURAL offer virtual whiteboards where teams can sketch, annotate, and collaborate.
- Flowchart and Diagram Creators: Lucidchart and draw.io enable users to create process maps, flowcharts, and organizational diagrams collaboratively.
- Interactive Presentation Platforms: Prezi is an example where presentations are not just linear but allow for dynamic interaction and collaboration.
- 3D Design and Modeling: Tools like SketchUp or Tinkercad let teams design and model in a collaborative 3D space.
Differentiating Between Visual Collaboration and Simple Visual Presentations
While both involve visual elements, there’s a distinct difference between visual collaboration and visual presentations.
Simple Visual Presentations are static visual elements, like a PowerPoint slide deck, designed to convey information. They are mostly one-way communication tools.
Visual Collaboration, on the other hand, emphasizes interactivity. It involves multiple users working together on a visual medium, providing feedback, making changes, and interacting with the content and with each other in real time.
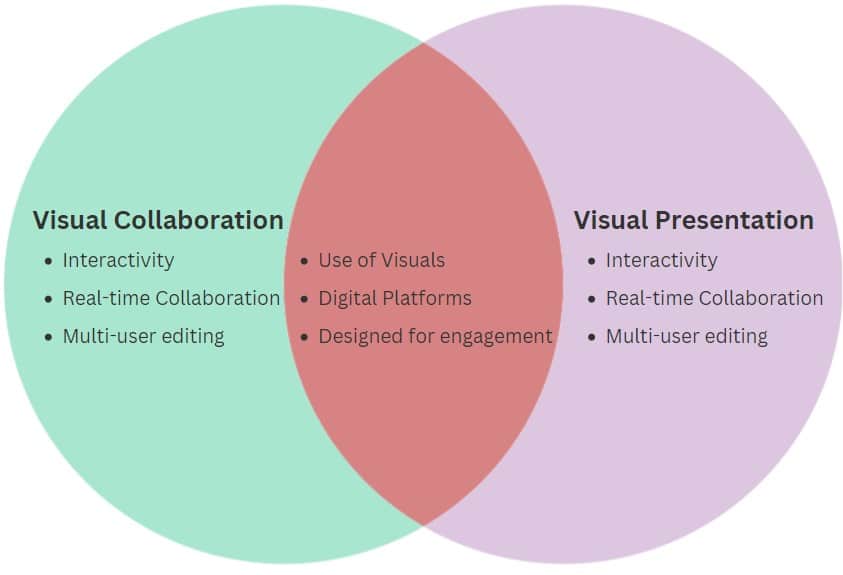
In essence, while visual presentations are about showing, visual collaboration is about doing together. As the digital workspace evolves, harnessing the dynamic capabilities of visual collaboration becomes more critical to keep teams connected, engaged, and productive.
The Science Behind Visual Collaboration
The phrase “A picture is worth a thousand words” is more than just an adage; it’s rooted deeply in the very fabric of human cognition.
Understanding why this is the case can provide valuable insights into the efficacy of visual collaboration.
Understanding the Dominance of Visual Information in Human Cognition
From the earliest cave paintings to the infographics of today, humans have always leaned on visuals to convey ideas, tell stories, and document knowledge. This predilection isn’t just cultural; it’s neurological.
The human brain is predominantly a visual organ. Approximately 30% of our cerebral cortex is dedicated to visual processing, compared to just 8% for touch and a mere 3% for hearing.
This makes vision the most dominant sense for most people. Furthermore, these visual processors are intricately connected to areas of the brain that manage our emotions and long-term memory, explaining why we’re more likely to recall and emotionally resonate with visual stimuli.
Statistics on Visual vs. Text-Based Information Processing
The advantage of visual over textual information is not just qualitative, but can be quantified through striking statistics:
- Rapid Processing: As mentioned in the introduction, the human mind can process images up to 60,000 times faster than text. This speed means that complex ideas can be grasped quickly when presented visually.
- Retention Rates: Studies have shown that after three days, people tend to remember only 10% of the information they hear. In contrast, if paired with a relevant image, the retention rate jumps to 65%.
- Engagement Metrics: Articles with images receive 94% more views than those without, showcasing the visual preference of audiences when consuming content.
- Complexity Simplified: Infographics can condense vast amounts of data or complex topics into digestible visuals, making them 30 times more likely to be read in entirety than pure text articles.
The data is clear: when text and visuals are pitted against each other, visuals consistently prove to be more efficient, memorable, and engaging.
This dominance underscores the necessity of integrating visual collaboration tools into our digital workspaces, allowing teams to tap into the innate strengths of our visual brains.
Benefits of Visual Collaboration in the Digital Workspace
In today’s rapidly evolving digital environment, merely having tools at our disposal isn’t enough. It’s imperative to understand the tangible benefits they offer. Visual collaboration, with its dynamic and interactive nature, brings forth numerous advantages to the digital workspace.
Improved Understanding and Retention
The intricate web of data we navigate daily, especially when extensive or multidimensional, often becomes overwhelming when conveyed through mere text or numbers. However, visual collaboration tools have the power to transmute this data into more digestible formats like charts, graphs, heat maps, and more.
By transforming raw data into visually appealing representations, comprehension becomes more intuitive. Not only does this aid in immediate understanding but the retention of key insights is significantly bolstered. Visual formats highlight patterns, trends, and anomalies, offering valuable insights that might remain hidden in a text-dense presentation.
To illustrate this, consider a heat map of website user engagement. A heat map visually displays where website visitors spend the most time or which sections of a page receive the most clicks. This emphasis on visual representation demonstrates how intricate data, when rendered visually, becomes more accessible and insightful, thereby enhancing both understanding and retention.

Facilitated Team Collaboration
In today’s interconnected world, global teams frequently grapple with linguistic and cultural differences that can spawn misunderstandings. Visual collaboration tools bridge this gap, leveraging the universal appeal of imagery to crystallize concepts that words might struggle to encapsulate.
Instead of navigating the cumbersome maze of protracted email exchanges awaiting feedback, teams now have the advantage of digital whiteboards and other visual collaboration platforms at their disposal. These tools empower teams to brainstorm synchronously, expedite decision-making, and guarantee alignment — ensuring everyone not only shares a virtual workspace but also a unified vision.
Increased Engagement
The pervasive ennui of video conference fatigue has become a tangible challenge in the digital work landscape. However, the integration of interactive visuals serves as an antidote, infusing fresh energy and vitality into virtual interactions. Instead of being mere spectators in a meeting, team members transform into active participants, engaging with shared visuals, annotations, and collaborative tools.
Visual collaboration platforms do more than just enhance meetings; they strive to replicate and even enhance the spontaneous interactions that naturally occur in physical workspaces. Be it a virtual brainstorming arena, a synchronized design sprint, or an interactive training forum, these tools breathe life and motion into what might otherwise be static digital interactions.
Popular Visual Collaboration Tools in the Market: Lucidchart
In the realm of visual collaboration, several platforms have carved a niche for themselves, earning the trust of businesses globally.
Among these frontrunners is Lucidchart.
Renowned for its versatility and user-friendly interface, Lucidchart is more than just a diagramming tool—it’s a comprehensive visual workspace.
Overview
Lucidchart stands as a testament to the transformative power of visual collaboration. Launched in 2008, this web-based platform offers users an intuitive interface to conceptualize, collaborate on, and decipher intricate ideas and workflows visually. Having carved its niche over the years, Lucidchart now proudly serves millions globally, enhancing clarity and synergy in team projects.
For a more immersive experience into the capabilities of Lucidchart, we invite you to watch this video showcasing the platform’s comprehensive visual collaboration suite:
Key Features
- Drag-and-Drop Interface: Users can easily create flowcharts, org charts, mind maps, and more with a simple drag-and-drop functionality.
- Real-time Collaboration: Multiple team members can work on a single document simultaneously, witnessing changes as they happen.
- Templates Library: Lucidchart boasts an extensive library of templates tailored to various industries and use cases, allowing users to jump-start their visual projects.
- Integration Capabilities: It seamlessly integrates with other popular platforms like Google Workspace, Microsoft Office, Slack, and more, enabling fluid collaboration and sharing across tools.
- Interactive Presentations: Users can convert diagrams into interactive presentations, making meetings more dynamic and engaging.
Use Cases
Lucidchart‘s adaptability has made it a favorite across various sectors:
- Business: From process documentation to strategy planning, businesses utilize Lucidchart to map out and streamline operations.
- Education: Educators and students alike leverage the tool to simplify complex concepts and foster collaborative learning.
- Software Development: Developers use Lucidchart for wireframing, user journey mapping, and database design.
- Marketing: The platform aids in creating marketing strategies, visualizing campaign flows, and customer journey mapping.
Why It Stands Out
Lucidchart’s edge lies in its commitment to enhancing collaboration. While many tools allow for visual creation, Lucidchart emphasizes shared understanding. With features geared towards team input and feedback, the tool ensures that visuals are not just created but are collaboratively understood and refined.
Witness the revolution in visual collaboration. If you’re eager to explore how Lucidchart can transform your team’s collaborative efforts, there’s no better time than now.
Potential Pitfalls and How to Overcome Them
Embracing visual collaboration tools comes with a multitude of advantages that can transform the way teams work and communicate. However, like all digital solutions, they come with their own set of challenges. By understanding these potential pitfalls from the onset, organizations can strategize to maximize the benefits while minimizing the risks.
1. Ensuring Security and Privacy with Online Visual Tools
Pitfall: As with any online tool, there’s the potential risk of data breaches or unauthorized access. Sensitive information mapped out in visual formats could be exposed if not properly protected.
Overcoming the Challenge:
- Choose Platforms with Strong Security Measures: Platforms like Lucidchart prioritize user security. Lucidchart, for instance, uses advanced encryption techniques, undergoes regular third-party security audits, and complies with global data protection regulations.
- Educate Your Team: Make sure your team understands the importance of not sharing sensitive visuals indiscriminately and is aware of password protection and other security features.
2. Avoiding Over-reliance on Visuals – Balancing with Text and Verbal Communication
Pitfall: While visuals are powerful, relying solely on them can lead to misinterpretation or missed nuances.
Overcoming the Challenge:
- Complementary Communication: Use visuals to complement text and verbal communication. A flowchart might outline a process, but accompanying text or verbal explanation can provide the necessary context.
- Feedback Loops: Encourage team members to ask questions and provide feedback on visuals to ensure clarity and understanding.
3. Addressing Potential Accessibility Issues for Visually Impaired Team Members
Pitfall: Visual collaboration tools, by nature, might pose challenges for team members with visual impairments.
Overcoming the Challenge:
- Alternative Formats: Ensure that important visuals are available in alternative formats, such as descriptive texts or audio descriptions.
- Accessibility Features: Platforms like Lucidchart are continuously improving their accessibility features. Utilize built-in accessibility tools and integrations to make content more accessible. Additionally, ensure that the platform works seamlessly with screen readers and other assistive technologies.
- Regular Training: Periodically train your team on best practices for creating accessible content, ensuring inclusivity.
Conclusion
In an ever-evolving digital landscape, visual collaboration tools have emerged as pivotal assets in bridging communication gaps, enhancing understanding, and fostering team synergy. While they hold the promise of revolutionizing the way teams interact and execute ideas, it’s imperative for organizations to approach their use with a balanced perspective.
Recognizing potential pitfalls and implementing strategies to counteract them ensures that these tools can be leveraged to their full potential, ushering in an era of enhanced productivity and collaboration. As teams continue to navigate the challenges and opportunities of the digital age, visual collaboration stands out as a beacon, guiding the way to more cohesive, inclusive, and efficient ways of working.