

The profitability analysis makes it possible to ensure project profitability. At least, it reduces the risk of loss!
One of our articles on the relationship between time and money is intended to familiarize the reader with the principles of equivalence.
This makes it possible to compare payments (or series of payments) by finding their equivalence over time.
Mastering this aspect is necessary since it corresponds to one of the pillars of the profitability analysis!
In this article, we now look at the profitability analysis and the calculation methods to carry it out.
This information comes from the project profitability analysis course of the University of Quebec at Trois-Rivières in collaboration with several professors (Ph.D.) and lecturers (M.SC. A OR MBA).
What is Project Profitability Analysis?
When we analyze the profitability of a project, we seek to guarantee that it will bring us more money than it cost us to carry it out.
In addition, we want to obtain a return higher than that which we could easily have received at the bank (or the credit union) if we had invested this money.
Ideally, we will seek to obtain a return that reflects the effort (monetary, physical, and psychological) that we have deployed in our investment!
The project profitability analysis consists in determining the minimum profitability threshold of investment. That is the point where the sum of expenses minus the sum of earnings equals 0 or the intended profitability target.
Again, we want to get a return that is representative of the effort we put into a project.
For example, if you have to spend $100,000 and 350 hours of work to get a 5% return when you can easily get 3% in the bank by doing nothing, then why put so much effort?
The profitability analysis is a tool that makes it possible to evaluate the performance of a project in addition to providing essential information for decision-making.
Basic Principle of Project Profitability Analysis
Before continuing with the techniques and calculations of profitability analysis, here are some basic notions relevant to the evaluation of investment projects. These notions are taken from (UQTR, 2018).
- The business case for a project should only take into account the additional costs and benefits of the project under consideration.
- It is important to use the relevant interest rates to compare the amounts of money available on different dates. Especially since some projects can be spread over several years. The rates used to perform the analysis are often those that can be obtained easily and without risk.
- Cash flows are “actual” cash inflows and outflows. Unlike accounting concepts, they do not refer to income and expenses.
- Additional costs such as start-up costs and the constitution of additional working capital must be added to the so-called “direct” cash outflows (purchase of equipment, installation costs, land, etc.). In the same vein, cash inflows such as government grants, tax credits, etc. must be deducted.
Project Profitability Analysis: Calculation Methods
In some cases, it is enough to take a look at the inflows and outflows of money to get a good idea of the profitability of a project. However, during a complex project, this way of doing things can quickly become nebulous.
In this article, without going through all the analysis methods, the most important ones are explained. Here is a table that presents these methods for analyzing the profitability of projects.
|
Project Profitability Analysis Methods |
Description |
Acronym |
| Payback Period | Determines the period of time required to recover the capital invested at the start of the project. |
PP |
|
Accounting rate of return |
Measures the “ratio between the average annual [net] profit and the average accounting investment during the project.” | ARR |
| Net present value | “Measures the difference between discounted positive cash flows and the present value of the amounts invested.” |
NPV |
| Internal rate of return | The internal rate of return corresponds to the interest rate for which the NPV equals 0. |
IRR |
|
Profitability index |
The ratio between cash inflows and cash outflows (“positive” and “negative” cash flow). | PI |
| Integrated internal rate of return | The integrated internal rate of return corresponds to the interest rate for which the NPV equals 0. However, this technique (unlike NPV, IRR, and IR) does not assume that cash flows are reinvested at a single rate. |
IRR* |
Translated from: (UQTR, 2018)
Payback Period (PP)
The payback period represents the minimum time needed to recover the capital invested in a project.
As a general rule, if a project pays for itself in 1 year or less, then we move forward. However, in larger projects, it could go well beyond a year.
To calculate the DR, here is the mathematical formula, along with the variables used in the equation:
DR = I / CF
where I represent the capital invested (initial investment) and CF the cash flow of the project by periods of time (week, month, year, or other).
Example:
The engineer of a company carries out a mapping of the value chain and targets the bottleneck of the factory.
By investing $50,000 to acquire a new, newer and faster machine, he estimates that the company could produce $2,000 in additional production per day. In addition, the company’s margins are 30%.
What would be the payback period for such a project?

Accounting Rate of Return (ARR)
The accounting rate of return method is based on “book earnings rather than cash flow”. This method calculates the “ratio between the average annual profit after tax and the average accounting investment during the project. (UQTR, 2018).
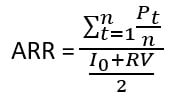
To calculate the ARR, here are the variables you need to know to understand the mathematical equation:
- ARR = Accounting rate of return
- Pt = Profit after tax in year “t”
- n = Project duration or project life
- I0 = Initial Investment
- RV = Residual value
Now that we know the variables, here is the formula for ARR :
Example:
A company plans to invest $250,000 to acquire a new machine. The life of the machine and its residual value are respectively 10 years and $50,000.
By investing in this machine, the company hopes to obtain the pre-tax profits presented in the table below. The company has a tax rate of 35% and the minimum rate of return required by senior management is 15%.
Should the company go ahead with the acquisition?
| Year | Earnings before amortization and tax | Amortization | Profits before tax | Net profit |
| 1 | 75 000$ | 20 000$1 | 55 000$2 | 35 750$3 |
| 2 | 75 000$ | 20 000$ | 55 000$ | 35 750$ |
| 3 | 75 000$ | 20 000$ | 55 000$ | 35 750$ |
| 4 | 60 000$ | 20 000$ | 40 000$ | 26 000$ |
| 5 | 60 000$ | 20 000$ | 40 000$ | 26 000$ |
| 6 | 60 000$ | 20 000$ | 40 000$ | 26 000$ |
| 7 | 50 000$ | 20 000$ | 30 000$ | 19 500$ |
| 8 | 40 000$ | 20 000$ | 20 000$ | 13 000$ |
| 9 | 30 000$ | 20 000$ | 10 000$ | 6 500$ |
| 10 | 25 000$ | 20 000$ | 5 000$ | 3 250$ |
| Total | 550 000$ | 200 000$ | 120 000$ | 227 500$ |
1. Depreciation calculation (Amortization):

2. Profits before tax:
Profits before tax = Profits before amortization and tax – Amortization
Profits before tax = 75 000$ – 20 000$ = 55 000$
3. Net profit:
Net profit = Profit before tax * (1 – i) where “i” represents the tax rate.
Net profit = 55 000$ * (1 – 0,35) = 35 750$
Calculation of the accounting rate of return:
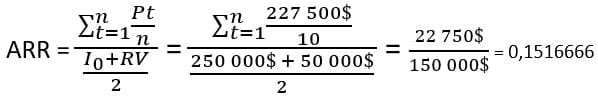
ARR = 15.16% ≥ 15%, so the company should proceed with the investment since it respects the minimum required rate.
It should be noted, however, that the accounting rate of return method has its risks since it is based on accounting figures rather than cash flows.
Net Present Value (NPV)
The NPV method calculates the difference between discounted cash inflows (positive cash flows) and the present value of the invested capital.
In this calculation, a “relevant” discount rate is established based on the risk level of the project and is the required rate of return. »
A risk-free rate can be used in a “certainty situation.” “. (UQTR, 2018).
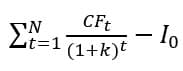
In the calculation of NPV, the variables are:
- CFt = Net cash flow at period “t”
- N = Total duration of the project (project life)
- k = Taux d’actualisation pertinent
- I0 = Initial investment
- It = Investment at period t
- M = Time required to make disbursements
The mathematical formula for net present value is:
In a context where the initial investment is spread over several periods, then we obtain the following expression for I0:
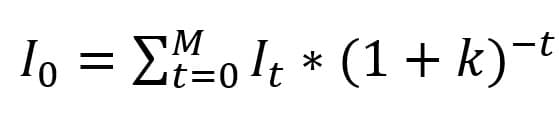
Now, let’s move on to an example to flesh out the NPV section.
Example:
The manufacturing company Steel Inc. wants to invest in a new laser cutting machine to increase its productivity.
After some research, the company is interested in a model at a cost of 100,000$.
According to their estimate, this machine would increase their profit by 15,000$/year for the next 10 years.
In 10 years, the company expects to be able to resell this machine for around 35,000$.
If the company uses a minimum acceptable rate of return of 12%, should it invest in this machine or continue its research?

The managers of Steel Inc. had better continue their search since it does not meet the minimum acceptable rate of return of the company. To do this, nearly $4,000 would be missing.
If the NPV is equal to 0, then this means that the minimum rate of return is respected. It goes without saying that judgment must therefore be used, especially in the context where the calculations are made with estimates. However, you have to try to put the odds on your side.
Internal Rate of Return (IRR)
The internal rate of return (IRR), or even the rate of return, of a project, corresponds to the rate where the NPV = 0. In the event that this rate is exceeded, a project is considered not profitable or does not meet the company’s profitability criterion (effort vs impact).
To isolate the IRR, the following formula is used:
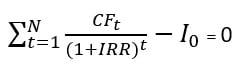
From this formula, it is not easy to isolate the internal rate of return since the relationship between the IRR and the NPV is not linear. Therefore, it is recommended to go by trial and error in the first place in order to find positive and negative values of the NPV.
Linear interpolation
| IRR | NPV |
| x1 | y1 |
| IRR | 0 |
| x2 | y2 |
Formula:

To increase the accuracy of the results, it is recommended to find values that do not exceed a 5% difference (between y1 and y2).
To better conceptualize this method, let’s proceed with an example!
Example:
A small cleaning company is considering acquiring an industrial robot vacuum to reduce labor costs and increase productivity.
Such a robot costs 5,000$ and the company estimates that it saves the amounts shown in the cash flow table below.
Annual projected cash flow from the robot vacuum cleaner project
| Year | Projected Cash flow (CFt) |
| 0 | -5 000$ |
| 1 | 2 500$ |
| 2 | 3 500$ |
| 3 | 3 000$ |
Now, to isolate the IRR, it is necessary to carry out some test calculations to find a positive and negative value in the NPV with a maximum deviation of 5%.
Note: With Excel, it is very quick to perform these trials and errors.
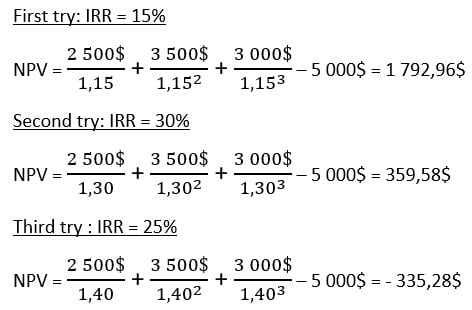
Linear interpolation:
| IRR | NPV |
| 40% | -335,28$ |
| IRR | 0 |
| 30% | 359,58$ |
Now, it is enough only to interpolate to obtain the internal rate of return of this project.
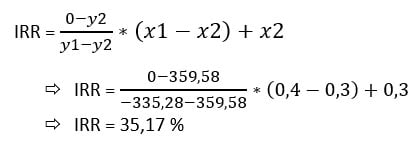
The IRR of this project is therefore 35.17% which is excellent. The company should therefore go ahead with this project.
Note: Going with more precise data results in an IRR of around 34.88%. The closer the NPVs are to 0, the greater the precision.
Profitability Index (PI)
The profitability index is a method that calculates the ratio between the positive and negative cash flows of a project. To consider a profitable project, the profitability index must be greater than 1.
To measure the PI, the following formula is used:

Example:
Let’s go back to the example carried out with the NPV. If Steel Inc. had used the profitability index method, what would have been their conclusion regarding their project?
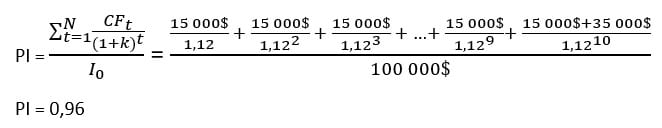
The profitability index is less than 1, so the company comes to the same conclusion as with the net present value method. It rejects the project because it does not achieve the minimum rate of return required by the company, i.e. 12%.
Integrated Internal Rate of Return (IRR*)
Finally, the last method presented in this article is the analysis of the integrated internal rate of return.
The NPV, IRR, and IR calculation methods are more precise than the first two methods (DR and TRC) presented since they take into account the value of money over time (time-money relationship).
However, the net present value, the internal rate of return, and the profitability index “assume that cash flows are reinvested at a single rate”. (UQTR, 2018).
With the integrated internal rate of return method, a reasonable and sustainable “rate of reinvestment” in the future is assumed in order to recalculate a project’s rate of return.
This, therefore, makes it possible to reduce the risk of certain projects and ensure their profitability. Since there is no certainty in investment, this method makes it possible to validate the profitability of the project with more conservative capital reinvestment rates.
This method is done in two steps. These will be presented as an example. The formulas will be presented at the same time.
Example:
Let’s go back to the example of the housekeeping company realized in the section on the internal rate of return. The IRR obtained was around 35%.
Let’s recalculate the rate of return, but this time with a reinvestment rate of 8%. Which seems more reasonable for the company.
| Year | Cash flow (CFt) |
| 0 | -5 000$ |
| 1 | 2 500$ |
| 2 | 3 500$ |
| 3 | 3 000$ |
Step 1:
Calculate the future value of positive cash flows with a reinvestment rate of 8%
Future value (FV) = $2,500 * (1+0.08)² + $3,500 * (1+0.08)¹ + 3000 * (1+0,08)^0
⇒ FV = $2,916 + $3,780 + $3,000
⇒ FV = $9696
Step 2:
Compare the future value with the initial investment to isolate the embedded internal rate of return.
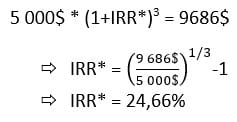
The rate of return goes from 35.17% to 24.66% with a reinvestment rate of 8% (versus 12% initially).
With an expected return like this, the company can go ahead with the project, and this is without worries since it is confident of being able to maintain a reinvestment rate of 8%.
Conclusion:
In conclusion, there are several methods to calculate the profitability of a project. In this article, without being exhaustive, the most popular methods have been explained and illustrated using examples.
Of the methods presented, the Net Present Value (NPV), Internal Rate of Return (IRR), and Profitability Index (IR) methods are considered more accurate, as it considers the relationship between time and money. Do not hesitate to consult our article on this subject.
Finally, the integrated internal rate of return (IRR*) method was explained. This method makes it possible to reduce the risk of projects by calculating the internal rate of return with a reinvestment rate lower than the IRR. This ensures the profitability of a project using a rate of reinvestment that the company is confident of achieving over the years.
Reference:
UQTR, 2018. Analyse de Rentabilité – Chapter 3, PDF.