

Now that the overall (strategic) and integrated (tactical) plans are complete, let’s move on to the master production plan (operational).
The master production plan aims to schedule the weekly manufacturing of finished products based on actual market demand. From this stage, we no longer operate in equivalent units (EU), but rather by product. The master plan stems from the integrated plan.
Master production planning has a horizon of 3 to 6 months. Planning is usually done weekly.
The image below presents production scheduling in its globality and is taken from (Stevenson & al, 2012).

Objectives of the master production plan
The master plan, also known as the master production schedule, is the continuation of the integrated plan. It is a more detailed plan and intended for production floors. We, therefore, operate with firm orders rather than forecasts. To carry out the master plan, we break down the integrated plan to plan the production of each product, and this in a precise way.
This type of plan aims to optimize resources and reduce a company’s total manufacturing cost. It tackles labor recruitment, dismissal, subcontracting, etc. in general.
The objective of the master plan is to assess the number of actual finished products to be manufactured or assembled for each product model, for each week of production. The master plan considers only the internal activities of the company. Subcontracting is therefore not included.
This, therefore, makes it possible to establish and meet delivery deadlines, plan production capacity and meet the objectives established in the integrated plan. As far as equipment is concerned, the stocks necessary for production are evaluated with the material requirements planning (MRP).
The MRP stems from the production master plan, just as the master plan stems from the integrated plan. The figure presented at the beginning of the text represents well the totality of the production planning.
How to move from an integrated to a master plan?
To illustrate how to break down an integrated plan into a master plan, this section presents a fictitious example.
Company ABC produces products A, B, C, D, and E. The demand forecasts are shown in the following table:
| A | B | C | D | E | |
| Person-hour/unit | 10 | 12 | 10 | 8 | 14 |
| Sales Forecast
(January-June) |
12 000 | 8 000 | 10 000 | 6 500 | 5 000 |
The next table presents the relation with the equivalent unit (EU) of each product. Product C was chosen as the common denominator.
| Calculation | Equivalent unit | Percentage | |
| Product A | 10/10 * 12 000 | 12 000 | 27,4 |
| Product B | 12/10 * 8 000 | 9 600 | 21,9 |
| Product C | 10/10 * 10 000 | 10 000 | 22,8 |
| Product D | 8 / 10 * 6 500 | 5 200 | 11,9 |
| Product E | 14/10 * 5 000 | 7000 | 16,0 |
| Totals | – | 43 800 | 100 |
According to ABC’s integrated plan, the sales forecast for the first 6 months of the year is as follows:
| January | February | March | April | May | June |
| 3 000 | 4 500 | 9 800 | 10 000 | 8 500 | 8 000 |
Now, let’s take the month of January as an example. There are 3000 equivalent units to be manufactured according to the integrated plan. By using the percentages of each product, we will obtain the quantity (in EU) of each product to be manufactured.
Then, they will be converted back to a real unit rather than an EU.
Here’s how it’s done in tabular form:
|
Equivalent unit to be produced in January for each product |
||||
| Product A | Product B | Product C | Product D | Product E |
| 3000*0,274 = 822 | 657 | 684 | 357 | 480 |
| January | |||||
| Week 1 | Week 2 | Week 3 | Week 4 | Total (EU) | |
| Product A | 750 | 72 | 822 | ||
| Product B | 657 | 657 | |||
| Product C | 21 | 663 | 684 | ||
| Product D | 87 | 270 | 357 | ||
| Product E | 480 | 480 | |||
| UÉ | 750 | 750 | 750 | 750 | |
The plane above is again an equivalent unit. Now is the time to convert the product quantities back to actual units. This is what will matter to us on the production side.
| Equivalent Unit | Real unit | |
| Product A | 822 * (10/10) | 822 |
| B | 657 * (10/12 | 547,5 => 548 |
| C | 684 * (10/10 | 684 |
| D | 357 * (10/8 | 447 |
| E | 480 * (10/14) | 343 |
| Total | 2 844 |
We, therefore, obtain the following plan for the month of January.
| January | |||||
| Week 1 | Week 2 | Week 3 | Week 4 | Total | |
| Product A | 750 | 72 | 822 | ||
| Product B | 548 | 548 | |||
| Product C | 21 | 663 | 684 | ||
| Product D | 109 | 338 | 447 | ||
| Product E | 343 | 343 | |||
| Real unit | 750 | 641 | 772 | 681 | |
For the other months, the same principles are applied.
How to make a master production plan?
Achieving a product master plan involves 5 steps:
- Build demand forecasts
- Know firm orders and initial stock
- Calculate projected inventory
- Determine production launches
- Calculate the quantities available for sale
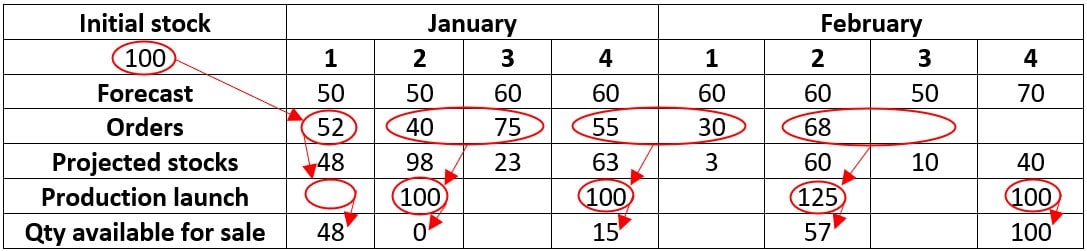
| Initial stock | January | February | ||||||
| 100 | 1 | 2 | 3 | 4 | 1 | 2 | 3 | 4 |
| Forecasts | 50 | 50 | 60 | 60 | 60 | 60 | 50 | 70 |
| Orders | 52 | 40 | 75 | 55 | 30 | 68 | ||
| Projected stocks | 48 | 98 | 23 | 63 | 3 | 60 | 10 | 40 |
| Production launch | 100 | 100 | 125 | 100 | ||||
|
Qty available for sale |
48 | 0 | 15 | 57 | 100 | |||
Formulas
Projected stocks =
Stock from the previous week – Max(forecast, orders) + Production launch
Quantity available for sale =
First week :
Initial stock + Production launch – Sum of orders until the next launch
Other weeks :
Production launch – Sum of orders until the next launch
Conclusion :
The production master plan is a tactical order plan that outlines the number of products to be produced each week. The planning horizon is 3 to 6 months and planning is done using firm orders and sales forecasts.
There is no Excel file available for this article yet, as blueprints are quite simple to make. However, the formulas are presented in the text. We do, however, offer a free file for integrated planning.
The next step in production planning is now material requirements planning (MRP).
Reference :